


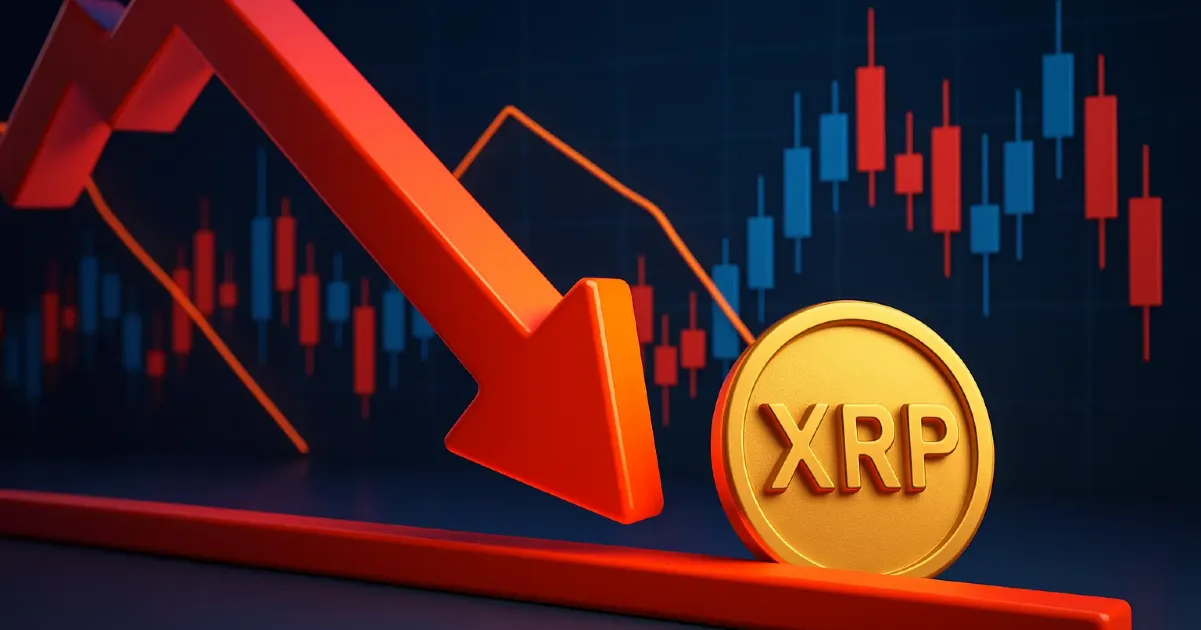
A key XRP chart signal that led to 25% average drops earlier in 2025 has flashed again. Traders are watching critical support levels for the next big move.
A subtle flash on the chart. That’s how XRP traders noticed the familiar pattern again. The same signal that, on average, has preceded 25% drops earlier in 2025 just made a cameo.
It’s enough to make long-term holders sit up and short-term traders wonder: is history about to repeat?
A Chart Pattern That Keeps Coming Back
This isn’t the first time the pattern has shown up. Earlier this year, the same technical formation popped three separate times, and each time, XRP sliced through support levels to fall roughly 20–30%.
The setup? A tight consolidation just above a key support line. It holds for a few days, then breaks violently. Most traders exited fast. Some walked into a sharp 25% drop.
Now that signal is flashing again. And, in a market where history won’t guarantee tomorrow’s price, it’s still a pretty loud bell.
Why 25% Feels Like the Pattern’s Signature
The math is striking: each of those three prior drops clocked in around 25% from peak to bottom. That’s consistent, and consistency is a scary thing when you see it three times in one year.
When the latest signal appeared this week, analysts ran the numbers and saw a familiar tale: consolidation, macro hesitance, then sharp breakdown. In each prior cycle, after holding above support for a few candles, XRP plunged fast once it broke.
It doesn’t mean it will happen again. But if the pattern holds, history says odds lean toward a similar move.
Momentum Indicators Are Turning
Chart watchers are also eyeing momentum. The Relative Strength Index (RSI), which had hovered comfortably in neutral territory, just slipped toward the 40s. That’s not extreme, but with prices pressing lower, it hints at fading buying strength.
At the same time, the Moving Average Convergence Divergence (MACD) shows a bearish crossover. In simple terms, trend strength may be shifting.
Imagine a sports game: the defense is holding, but the offense is tiring. Eventually, the momentum swings.
Support and Resistance: What Traders Are Watching
XRP’s critical zones are well-defined. The band between $0.47 and $0.50 has been key support all year. And each time Price visited that level, it either bounced or broke hard.
Right now, XRP sits just north of $0.50. A breakdown below $0.47 with volume could mean a visit to the next floor, which sits between $0.38 and $0.40.
Above, resistance lies around $0.55–$0.57. It hasn’t been tested in weeks. So the range path looks clear unless something dramatic stirs.
Bear Case vs Bull Scenario
Bear case: The signal holds. Support drops. XRP falls 20–30%, retests $0.38. Momentum shifts negative, and buyers step back.
Bull case: The signal is a false alarm. Price holds above $0.50, RSI rebounds, the MACD line flips, and support stands firm. If renewed buying emerges, price could make a modest bounce toward $0.60.
Both scenarios are possible. Chart history gives an edge to the bears but not a guarantee.
This Signal Isn’t the End It’s a Warning
Put simply, signals like this are early alerts. They’re not market calls. They don’t say "sell everything." They say, "Pay attention."
If you’re holding XRP long-term, maybe tightening stop-losses or adjusting position sizing makes sense now.
If you’re trading short-term, perhaps waiting for first-level confirmation, like a weekly close below $0.47, matters more than reacting on intraday dips.
Why It Matters for 2025
XRP has struggled to regain momentum since early 2025. A mix of macro pressures, crypto-wide challenges, and pending Ripple news meant bulls hadn’t been able to push decisively higher.
This recurring signal, then, reads like a fracture, a warning that momentum is weakening and buyers are losing steam.
It may be a shakeout before a rally or a deeper test before buyers return.
What’s Next: Key Dates & Catalysts
Events to keep an eye on:
- Ripple court news: Any announcement there could move XRP violently.
- Macro headwinds: broader crypto sentiment, Fed commentary, and inflation data.
- Volume trends: Buyers will need to step up near $0.47–$0.50.
- Spin on this signal: If price consolidates and RSI rebounds, fear fades fast.
In short, a few days to a few weeks matter more than price action alone.
A Note on “History Doesn’t Repeat”
Charts aren’t prophecy. Markets change. Economic conditions evolve.
Still, patterns don’t flash meaningless signals by accident. If the price breaks $0.47 and follow-through gains volume, historical odds based on 2025 experience lean toward another 20–30% drop.
But if price holds and momentum flips positive, this could end up being a damp squib, a signal that never triggered the full pattern.
Final Take
XRP is flashing a signal that, earlier in 2025, led to consistent drops of around 25%. The setup is in place again. That doesn’t make today's position negative, but it calls for awareness.
Traders and investors should watch $0.47–$0.50 closely. A breakdown could usher in a double-digit retrace. A rebound could signal the bulls are still holding the line.
Either way, it’s time to pay attention because XRP's chart is talking, and history is listening.
Related Articles

Price Predictions: Bitcoin Momentum & Ethereum Rally (8/13)
July Crypto Outlook: Bitcoin Eyes Breakout, Ethereum Holds Strong, Altcoins Poised for Shift
